

What CFOs Still Don't See About Business Travel Spend in 2026


TLDR;
- The biggest gap in CFO travel spend visibility is out-of-platform leakage: 15 to 35% of true T&E spend at most mid-market programs flows through direct bookings, personal cards, and shadow channels that never appear in the TMC dashboard. The reported total understates reality by that share
- Group and event travel is structurally separate from program data at most companies. SKO, customer conferences, exec offsites, and trade shows often book through marketing or events teams using a different vendor stack, so the unified spend view is incomplete
- Hotel loyalty points represent a private return to the traveler that the company funds but does not see. A Platinum-status Marriott Bonvoy traveler earns roughly 26 to 31% of corporate stay spend back in personal points value, money the company is paying without realizing where it goes
- Three of the seven blind spots are not cost lines at all. They are value gaps: lost productivity from bad routing, retention erosion from poor traveler experience, and customer-deal impact from missed or degraded meetings. These show up in P&L lines that have nothing to do with travel and finance never traces them back
- Scope 3 emissions from business travel are now a board-level reporting requirement under SEC climate disclosure rules and EU CSRD. Most CFOs are months from being able to produce this number cleanly, and the gap is closing fast
Most CFOs running quarterly business reviews in 2026 open the travel and expense dashboard with confidence. The total spend number is current. The category breakdown looks clean. The variance against budget is computed. The vendor concentration is visible. The dashboard answers the questions the CFO learned to ask. The problem is that the questions worth asking in 2026 are different, and several of them produce numbers the dashboard does not show. The gap between what the dashboard reports and what the program actually does is widening, and the missing data is exactly what determines whether the travel investment is paying off.
This piece is for CFOs, finance directors, and senior finance leaders who want a clear-eyed view of where their business travel spend visibility breaks. We cover seven specific blind spots that show up in nearly every mid-market and enterprise travel program in 2026, why each one is invisible to standard reporting, what the cost or risk looks like when each blind spot is sized, and where the visibility gets recovered. None of the seven require new tooling that does not exist; most require the existing tools to be configured against questions finance leadership has not historically asked.
Why CFOs think they have visibility
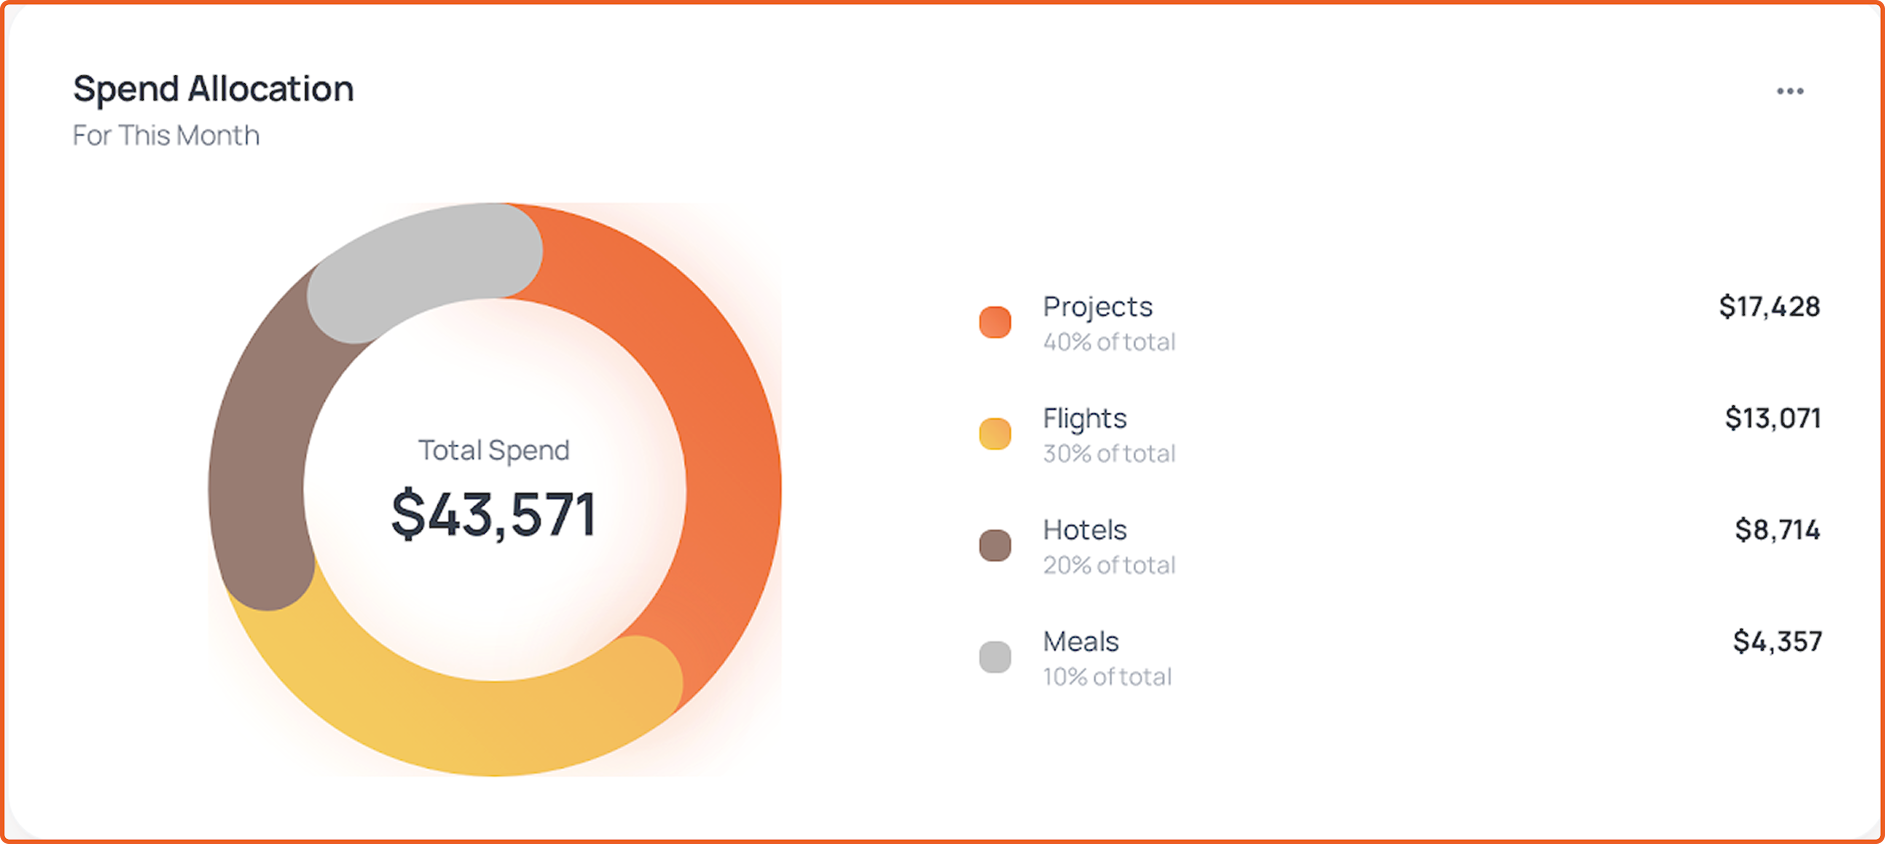
The standard travel and expense dashboard at most mid-market companies shows six metrics: total spend year-to-date, category breakdown (air, hotel, meals, ground, other), variance against budget, top vendors by spend, average cost per trip, and a list of policy exception flags. These six metrics are accurate as far as they go. They cover the spend that flows through the TMC and the corporate card program.
The CFO conversation about travel for the past 15 years has been built on these six metrics. Travel managers report against them. RFPs are scored against them. Budget reviews use them as the anchor. The dashboard answers the questions finance leadership learned to ask in 2010.
In 2026, the questions worth asking are different. Travel costs rose materially since 2024. Sales motions doubled down on in-person customer touches. AI changed which expenses can be automated. Talent retention got tighter for road-warrior roles. ESG reporting moved from voluntary to mandatory. The standard dashboard was not designed to answer any of these. The seven blind spots below are where the gap shows up.
Blind Spot 1: Out-of-Platform Leakage
The largest visibility gap at most mid-market programs is the spend that bypasses the TMC entirely. Direct bookings on airline websites, hotel-chain websites, OTAs (Expedia, Booking.com), and personal-card reimbursements escape the centralized booking platform and surface only in expense reports (if at all). Industry data on mid-market programs typically puts out-of-platform leakage at 15 to 35% of true T&E spend, with the higher band concentrated in programs that lack pre-trip approval enforcement.
The blind spot matters because the TMC-reported "$5M annual travel spend" may understate true spend by $750K to $1.75M, which means budget variance, vendor concentration analysis, and policy compliance reporting are all working off an incomplete data set. Cost-per-trip metrics look better than reality because the most expensive last-minute trips are precisely the ones that bypass the program.
A travel coordinator at a J.P. Morgan-card-using construction firm told us their Mexico team was "using personal cards, manual flight booking by internal person, disorganized hotel/car arrangements." The spend hit the corporate card statement eventually, but never flowed through the centralized travel platform, so the program's visibility into routing decisions and supplier mix on that region was zero.)
The fix is closing the booking workflow so that out-of-platform spend either gets routed back into the program (via approval gates, virtual cards, or HRIS-synced policy enforcement) or gets explicitly tracked as a shadow channel with its own line in the dashboard. For more on how T&E platforms close this gap, see our coverage of travel and expense management tools.
Blind Spot 2: Group, Event, and Conference Travel
The second-largest visibility gap is group and event travel. The annual sales kickoff, the customer conference, the partner roadshow, the executive offsite, and the trade show booth setup typically book through marketing, sales ops, or events teams using a different vendor stack than the corporate TMC. Hotel blocks are negotiated directly with the property. Event registration is handled by an event-management platform. Group air is sometimes brokered through a separate group-travel desk.
The result is that 20 to 40% of total travel spend at most mid-market programs lives in a parallel data structure the CFO's dashboard does not see. The CFO knows the budget for the SKO and signs off on the event total, but the per-traveler cost, the hotel rate adherence, the routing efficiency, and the policy compliance on those trips are not visible in the same dashboard that tracks routine business travel.
The integration fix is real work. Some travel platforms include an events module that brings group bookings under the same data umbrella as routine travel. Others require manual back-fitting at quarter-end. The choice is between paying the integration cost upfront or paying the visibility cost forever.
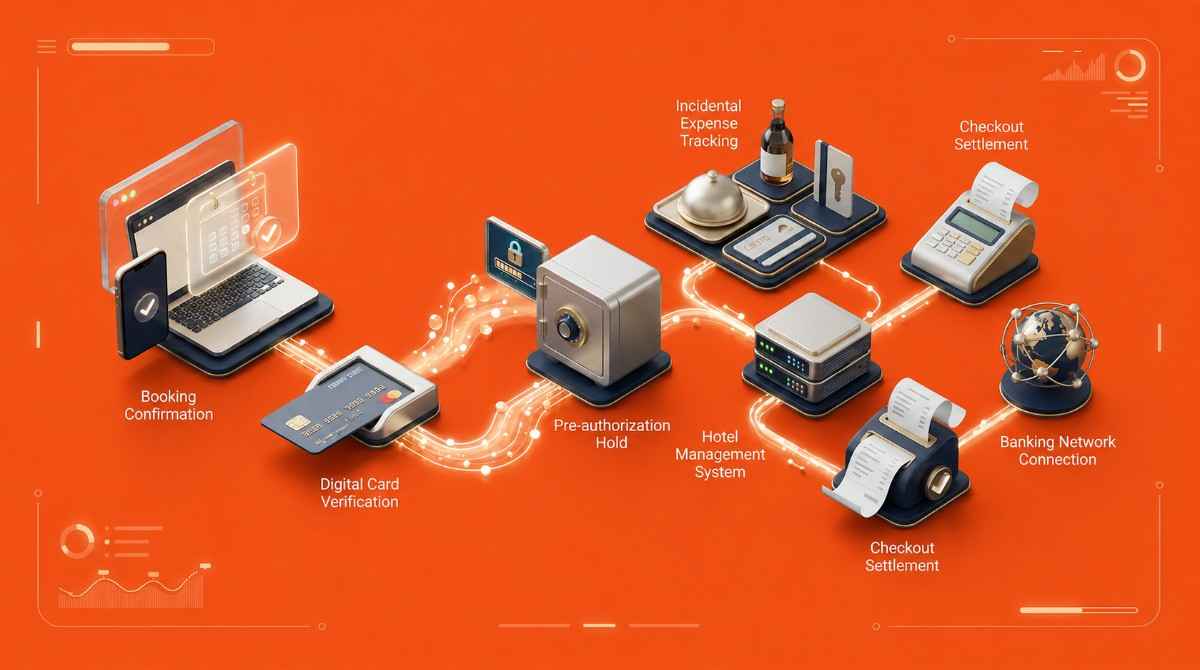
Blind Spot 3: Hotel Loyalty Asymmetry
The hotel loyalty points earned on business travel belong to the traveler, not the company funding the stay. A Platinum-status Marriott Bonvoy traveler typically earns 28,000 to 30,000 points on a $960 corporate three-night stay, worth $250 to $300 in personal redemption value. The company paid $960. The traveler banked roughly 26 to 31% of that as private value. The CFO dashboard shows the $960. It does not show the $250 to $300 private return, and it does not flag the systematic rate premium the company pays so the traveler accrues those points.
This is structural, not a cheating problem. Hotel loyalty programs are designed for the corporate-paid business traveler precisely because the chooser and the payer are different people. For the full mechanics, see our breakdown of why business travelers stay loyal to the same hotels even when they're more expensive.
The CFO visibility fix is making the loyalty-rate-premium cost visible at booking and at quarterly review. The company can decide deliberately whether to absorb the premium as a traveler-experience benefit or contain it with neighborhood-level rate caps. The absorbed-silently default that most programs run on is the actual blind spot.
Blind Spot 4: Time-Cost of Bad Routing Decisions
When a travel program books DFW for a traveler heading to a Las Colinas meeting where Dallas Love Field would have saved 30 minutes of ground time, the airfare line on the dashboard is correct but the program just spent 30 minutes of the traveler's Tuesday morning. Multiply by 200 travelers and a year of bookings, and the time cost is meaningful. None of it appears in the travel spend dashboard.
The time-cost shows up in other P&L lines: lower sales productivity, longer time-to-close, more makeup-overtime hours, slower customer response. Finance does not trace these back to travel routing decisions because the dashboard does not connect them. The dashboard only shows airfare cost, hotel cost, and ground transport cost in isolation.
The visibility fix is reporting that includes total trip time (door-to-door, not just gate-to-gate) and routing-quality scoring. Programs that include this metric typically discover that 15 to 25% of trips have a clearly better routing option that costs slightly more in dollars but saves materially more in time. The right answer per trip depends on what the traveler's time is worth to the business.
For more on the broader CFO pain context that this visibility gap sits inside, see our analysis of pain points hitting CFOs in 2026.
Blind Spot 5: Retention Impact on Road-Warrior Roles
Traveler experience is now a meaningful retention driver for road-warrior roles (SDRs, AEs, customer success, field engineering, consulting). A bad booking workflow, a clunky mobile app, a policy that fights the traveler instead of supporting them, and inconsistent in-trip support all contribute to retention friction that shows up in exit interviews and exit data, not in the T&E dashboard.
The cost of replacing an experienced AE at most companies sits in the $150K to $400K range when fully loaded (recruiting, ramp time, lost pipeline). When a portion of churn traces to travel-experience friction, the financial impact lands in the salary and pipeline lines, not in the travel line.
CFOs running this analysis well typically partner with the CHRO on a joint metric: traveler-NPS by role and segment, correlated against retention data over twelve to twenty-four months. The companies running this conversation actively in 2026 are mostly those that already lost a high-performing road-warrior team to a competitor with better tools and decided to investigate why.
For more on the broader finance-team operating model that supports this kind of cross-functional partnership, see our piece on the role of finance teams in AI-automated travel and expense.
Blind Spot 6: Customer-Deal Impact
The hardest blind spot to quantify and the most material when sized correctly: business trips drive customer outcomes, and the variance in customer outcomes traces back to trip quality. A delayed Monday morning departure becomes a delayed Monday customer meeting becomes a deal that slips a quarter. A poor hotel selection becomes a tired AE walks into a board demo. A bad ground-transport reservation becomes a late arrival at a CFO closing meeting.
These show up in the sales line, the customer-success retention line, and the partnership-revenue line. They never show up in the travel line. The trip itself was within budget, on policy, and reported correctly to finance. The deal that turned on the trip lived in a different system.
CFOs running this analysis well typically build a joint sales-and-finance review where the top 10 deal slips of the quarter get a "did travel friction contribute" review tag. The point is not blame; the point is whether the travel program is fit for the sales motion it is supposed to support. Programs running this conversation in 2026 are mostly companies whose revenue is sensitive to in-person customer touch frequency.
Blind Spot 7: Scope 3 Emissions and ESG Reporting
Scope 3 emissions from business travel are now a board-level reporting requirement under SEC climate disclosure rules (finalized 2024 with phase-in through 2026) and EU CSRD reporting that affects any US company with material EU operations. Most CFOs are months from being able to produce a defensible Scope 3 travel number cleanly, and the gap is closing fast as audit standards tighten.
The standard travel dashboard tracks dollars, not carbon. Translating air miles, hotel nights, ground transport, and conference attendance into CO2-equivalent emissions requires a methodology, a data feed from the travel platform, and an audit trail. None of these come built-in to legacy TMC reporting. Some modern platforms now ship Scope 3 emissions reporting as a standard module. Most do not.
The board-level question for 2026 is whether the company can answer "what were our travel-related Scope 3 emissions this quarter and how are they trending" in a five-minute slide. CFOs at companies that cannot are working on a remediation plan, often quietly, to avoid an external-audit surprise.
For broader context on how CFOs are responding to the 2026 cost-and-compliance picture, see our coverage of the six cost levers CFOs are pulling in 2026.
When the seven blind spots compound
The seven blind spots above do not exist independently. They compound. A program with high out-of-platform leakage also has worse time-cost visibility because the shadow bookings often choose convenience over efficiency. A program without group-and-event integration also typically has weaker Scope 3 reporting because the event-side carbon data lives in the same parallel system. A program with the loyalty-asymmetry blind spot also tends to have a traveler-experience-and-retention blind spot because both stem from the same "what's good for the traveler is invisible to finance" pattern.
When the seven compound, the gap between reported travel spend and true travel impact can run 30 to 50% of the reported number. The CFO does not see this because the dashboard does not show it. The travel manager often does not surface it because the conversation does not have a place to land. The result is a quietly mispriced travel investment that the executive team and board are not equipped to challenge.
A finance leader at a multi-location healthcare staffing firm told us their spend visibility was "month-to-month at best" and that they could not forecast forward "because it's all about what our sales team generates." The forecasting visibility gap is downstream of the seven structural visibility gaps. Finance teams that close the seven structural gaps gain the ability to forecast for the first time.
What changes in 2026 to close the gaps
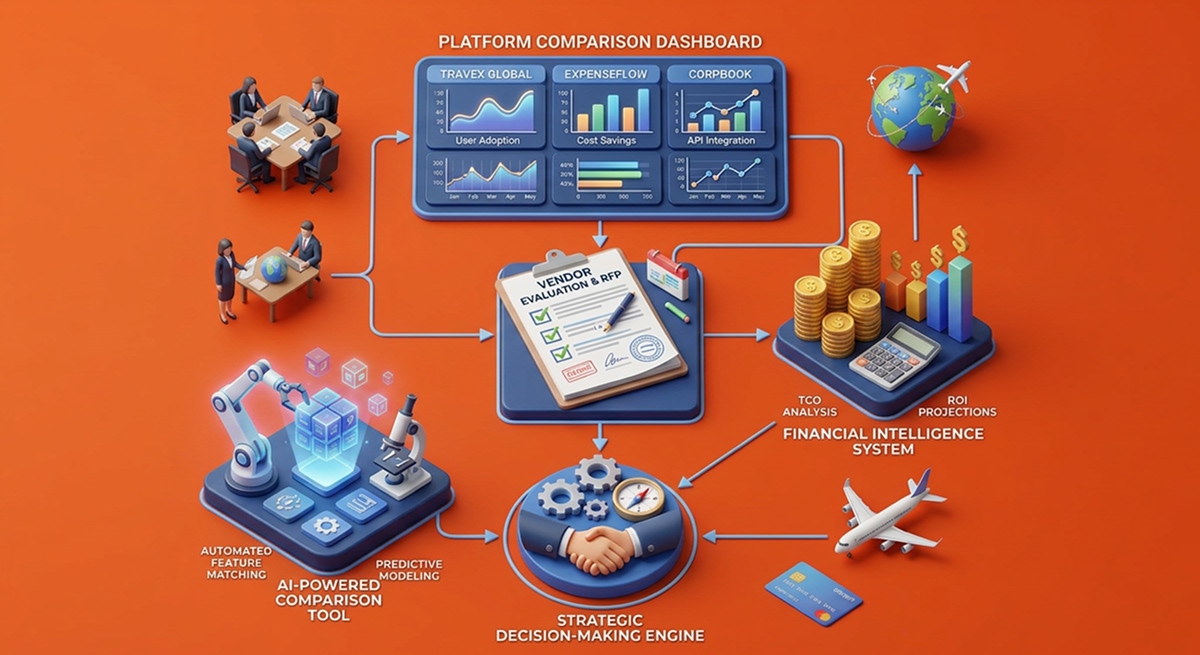
Three platform-level shifts in 2026 close most of the seven blind spots when configured deliberately:
- Unified data architecture: Modern T&E platforms now integrate booking, expense, card, group-events, and emissions reporting in a single data layer. The data structure was the blocker in 2020. In 2026 it is a platform-selection decision.
- Pre-trip enforcement: Policy compliance moves from post-trip exception review to pre-trip pre-emption at booking. The out-of-platform leakage problem and the time-cost-of-routing problem both close materially when the platform catches the issue before the booking.
- Cross-functional reporting: Travel data integrates with HRIS (for retention analysis), with sales-cycle data (for customer-deal impact), and with finance ledger data (for true total cost of travel). The reporting question shifts from "how much did we spend on hotels" to "is the travel program supporting the business outcomes we hired travel to deliver."
ITILITE was architected around these three shifts. The platform integrates booking, expense, card, and (in 2026 product roadmap) emissions reporting in a single data layer; enforces policy at booking time across all spend channels; and exports cross-functional data to finance, HR, sales, and ops systems for the integrated reporting that closes the blind spots. The visibility fix lives at the platform layer, and the platform-selection decision is the highest-impact move a CFO can make against the blind-spot list.
For more on the corporate-card-and-expense-side of this visibility picture, see our coverage of business travel and expense cards.
FAQ
What is the biggest blind spot CFOs have in business travel spend?
Out-of-platform leakage is the largest. At most mid-market programs, 15 to 35% of true T&E spend flows through direct bookings, personal cards, and shadow channels that never appear in the TMC dashboard. The reported total understates reality by that share, which means budget variance, vendor concentration, and policy compliance metrics all work off incomplete data.
How much business travel spend typically bypasses the TMC?
Industry data on mid-market programs puts out-of-platform leakage at 15 to 35% of true T&E spend, with the higher band concentrated in programs that lack pre-trip approval enforcement. Direct airline bookings, hotel-chain direct, OTAs (Expedia, Booking.com), and personal-card reimbursements are the main shadow channels.
Why is group and event travel separate from program data?
Group and event travel (SKO, customer conferences, exec offsites, trade shows) typically books through marketing, sales ops, or events teams using a different vendor stack than the corporate TMC. Hotel blocks are negotiated directly, event registration goes through an events platform, group air is brokered through a separate group-travel desk. Without explicit integration, 20 to 40% of total travel spend lives in a parallel data structure.
How do hotel loyalty points create a CFO visibility gap?
Hotel loyalty points belong to the traveler, not the company. A Platinum-status Marriott Bonvoy traveler earns roughly 26 to 31% of corporate stay spend back in personal points value. The CFO dashboard shows the room rate paid. It does not show the private return to the traveler or the rate premium the company pays so the traveler accrues those points.
What is Scope 3 emissions reporting and why does it affect business travel?
Scope 3 emissions are indirect emissions from a company's value chain, including business travel. SEC climate disclosure rules finalized in 2024 and EU CSRD make Scope 3 reporting board-level required through phase-in by 2026. Most CFO travel dashboards track dollars not carbon, so producing a defensible Scope 3 travel number requires methodology, data feed, and audit trail that legacy TMC reporting does not deliver.
How does poor business travel impact talent retention?
Traveler experience is a meaningful retention driver for road-warrior roles (SDRs, AEs, customer success, field engineering, consulting). Bad booking workflow, clunky mobile app, friction-creating policy, and inconsistent in-trip support contribute to retention friction that shows up in exit data, not in the T&E dashboard. The cost of replacing an experienced AE is typically $150K to $400K fully loaded.
How can a CFO close these business travel spend blind spots?
Three platform-level shifts close most of the seven blind spots: unified data architecture (booking, expense, card, events, emissions in one layer), pre-trip enforcement (policy applied at booking time, not post-trip), and cross-functional reporting (travel data integrated with HRIS, sales, and finance ledger). The platform selection is the highest-impact CFO move against the blind-spot list.

Ardra is a Content Strategy Manager at ITILITE with 6+ years of experience in travel and SaaS content. She holds a Master’s degree in Political Science from Lady Shri Ram College for Women and transitioned from academic research and travel content into SaaS content strategy.
She previously worked with JustWravel, where she focused on travel storytelling and digital content. Today, she specializes in SEO and AEO-driven content strategies that help businesses simplify complex travel and expense workflows into search-optimized narratives.
When she’s not working, Ardra is usually reading or watching films.
See what your travel spend dashboard misses
A fully integrated corporate travel management software that dramatically reduces spends while improving user experience
.jpeg)

.jpeg)


.jpeg)

%20(1).png)
%20(1).png)


.jpeg)


.jpeg)
.jpeg)

.webp)

.jpeg)
.jpeg)

.webp)


.png)